Crypto Insights Daily – April 7, 2025 🚀
- Crypto Alpha

- Apr 7, 2025
- 5 min read
Updated: Apr 8, 2025

Markets may wobble, but conviction should never flinch. In today’s edition of Crypto Insights Daily, we unpack how XRP's ecosystem continues to mature, why Bitcoin Dominance is flashing signals, and what the Fear & Greed Index is telling us about upcoming volatility. We also take a tactical look at how technical analysis can guide you through uncertain waters and uncover profitable entry points—especially when sentiment dips and opportunities rise.
Market Overview

The cryptocurrency market is experiencing notable movements downward today:
Price | 24h Change | 7d Change | |
Bitcoin (BTC) | $74,837.59 | ▼ 5.6% | ▼ 10.7% |
Ethereum (ETH) | $1,457.97 | ▼ 19.7% | ▼ 21.3% |
XRP | $1.8071 | ▼ 5.8% | ▼ 9.3% |
Solana (SOL) | $100.78 | ▼ 17.6% | ▼ 20.3% |
Pepe (PEPE) | $0.00000766 | ▼ 6.87% | ▼ 12.4% |
Market Metrics

Total Cryptocurrency Market Cap: $2.41 trillion, reflecting a flat movement over the past 24 hours.
Bitcoin Dominance (BTC.D): 63.5%, indicating BTC's continued market leadership.
Altcoin Market Capitalization: $694 billion, as investors show slowing interest in alternative cryptocurrencies.
Note: Cryptocurrency market metrics are highly dynamic and can change rapidly. For the most current information, refer to reliable financial news sources or real-time market data platforms.
Current Market Sentiment

Crypto Fear & Greed Index: 17 (Extreme Fear)
Investor Outlook: Caution persists amid regulatory developments and market fluctuations.
A Crypto Fear & Greed Index reading of 17 indicates that the market is in a state of extreme fear, suggesting potential panic selling and a possible buying opportunity for those who are comfortable with risk.
Note: The Crypto Fear & Greed Index is a tool that measures the prevailing sentiment of the cryptocurrency market, ranging from 0 (Extreme Fear) to 100 (Extreme Greed). It helps investors gauge market emotions, which can influence buying and selling decisions.
For a historical view of the Crypto Fear and Greed index check out this site below.
Daily Highlights

Crypto for Beginners
Here is a easy and fun way to learn crypto. Pass this along to your family and friends - it's only an 11 minute listen and it could increase your knowledge and awareness of crypto!
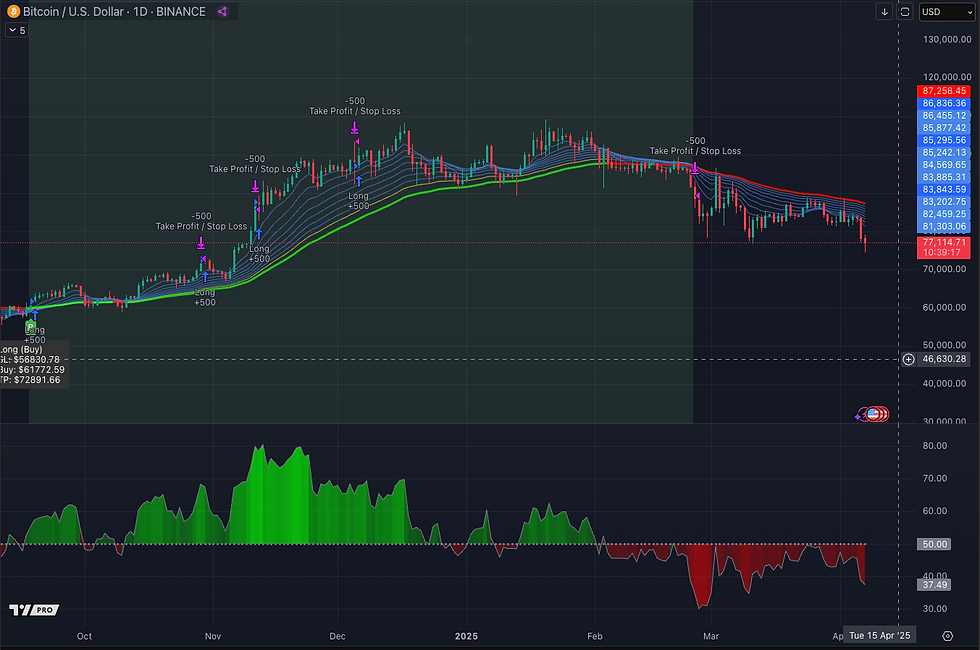
Bitcoin Price Analysis: Bitcoin's price fell below $80,000, reflecting market volatility influenced by global geopolitical tensions. Analysis suggests potential for a sell-off if U.S. equities continue to decline. However, some analysts remain bullish, citing historical trends of Bitcoin outperforming gold. The price is consolidating between $81,000 and $88,000, with a potential rise if resistance is broken.
Market Uncertainty: Bitcoin's drop below $80,000 coincided with concerns of a stock market crash reminiscent of 1987. Despite this, Bitcoin showed resilience. U.S. stocks experienced significant losses, and market observers, including Jim Cramer, highlighted the vulnerability of the market, suggesting a scenario similar to the 1987 crash could still occur.
Solana's Market Performance: Solana's TVL reached a new high, and DEX volumes remained strong despite challenges like a staking unlock and declining interest in memecoins. Solana's focus on scalability and Web3 integration has helped it secure its position as a leading platform for DeFi, second only to Ethereum, despite MEV concerns.
XRP Price Movement: XRP's price is facing a potential 25% decline due to an inverse cup and handle pattern. Whale distribution activity suggests selling pressure, and a breakdown below key support levels could lead to further declines. However, a strong close above resistance could invalidate the bearish pattern.
Deep Dive

Staying Calm When Crypto Is Down
Using Technical Analysis to Find Buying Opportunities
The cryptocurrency market is known for its volatility, with prices often experiencing significant swings in short periods. For new investors, these fluctuations can be nerve-wracking, leading to panic selling or impulsive decisions. However, seasoned traders understand that market downturns can present valuable buying opportunities. In this guide, we'll explore how to stay calm during market dips and use technical analysis to identify potential entry points.

The Importance of Staying Calm
Emotional decision-making can lead to poor investment choices. When the market is down, it's essential to remain calm and avoid making impulsive decisions based on fear or uncertainty. Instead, take a step back, assess the situation objectively, and use technical analysis to guide your decisions.
Understanding Technical Analysis
Technical analysis involves studying historical price data and chart patterns to predict future price movements. By analyzing trends, support and resistance levels, and various indicators, traders can identify potential buying opportunities during market downturns.
Key Technical Analysis Tools
Support and Resistance Levels: Support levels are price points where an asset tends to find buying interest, preventing further declines. Resistance levels are price points where selling interest emerges, preventing further increases. Identifying these levels can help traders determine potential entry and exit points.
Moving Averages: Moving averages smooth out price data over a specific period, providing insights into the overall trend. Commonly used moving averages include the 50-day and 200-day moving averages. When the price is above these averages, it may indicate an uptrend, while a price below may suggest a downtrend.
Relative Strength Index (RSI): The RSI measures the speed and change of price movements, ranging from 0 to 100. An RSI below 30 indicates that an asset may be oversold, while an RSI above 70 suggests it may be overbought. Traders often look for oversold conditions during market downturns as potential buying opportunities.
Fibonacci Retracement: Fibonacci retracement levels are horizontal lines that indicate potential support and resistance levels based on the Fibonacci sequence. These levels can help traders identify potential reversal points during price corrections.
Identifying Buying Opportunities
When the market is down, use the following steps to identify potential buying opportunities:
Analyze the Trend: Determine the overall trend using moving averages and trendlines. Look for signs of a potential reversal or continuation of the trend.
Identify Support Levels: Look for strong support levels where the price has historically found buying interest. A bounce off a support level may indicate a potential entry point.
Check Indicators: Use indicators like the RSI to assess whether an asset is oversold. An oversold condition combined with a bounce off a support level may present a buying opportunity.
Consider Fibonacci Levels: Use Fibonacci retracement levels to identify potential reversal points during price corrections.
Set Stop-Loss Orders: To manage risk, set stop-loss orders below key support levels to limit potential losses if the price continues to decline.
Conclusion
Market downturns can be challenging, but they also present opportunities for savvy investors. By staying calm and using technical analysis to identify potential buying opportunities, you can make informed decisions and potentially capitalize on market dips.
Remember to manage risk, conduct thorough research, and maintain a long-term perspective to navigate the crypto market successfully.
Here's the great news, My Crypto Trade alerts with AI does all the above and more so you don't have to!!! 👇
Note: The information provided is based on the current market conditions and is subject to change with market dynamics.
Do you want to know when to buy and when to sell a crypto? Opt-In for Free Crypto Trade Alerts (Beta)

Introducing the Crypto Alpha Ultimate Algorithm BETA—Now in Beta & Free for Early Subscribers!
Get real-time crypto trade alerts directly to your email & phone.
Why Join?
Powered by the Crypto Alpha Algorithm: Identifies optimal buy/sell signals based on real-time market conditions.
Institutional-Grade Data: Leveraging cutting-edge analytics for maximum accuracy.
Beta Launch = Free Access!: Get in early while we fine-tune the algorithm.
This is your chance to get real-time insights from a powerful crypto market algorithm at no cost.
👇 Opt-in now and start receiving trade alerts! 👇


Comments